Grade Level
3, 4, and 5
Difficulty
Intermediate
Duration
45 minutes
Subjects
Arithmetic
Art
Craft
Design & technology
Engineering
Fun
Game Design
Mathematics
Science
Statistics
STEAM
Summer Camp
Woodworking
-
Recognize a statistical question as one that anticipates variability in the data related to the question and accounts for it in the answers. For example, “How old am I?” is not a statistical question, but “How old are the students in my school?” is a statistical question because one anticipates variability in students’ ages.
-
Understand that statistics can be used to gain information about a population by examining a sample of the population; generalizations about a population from a sample are valid only if the sample is representative of that population. Understand that random sampling tends to produce representative samples and support valid inferences.
-
Understand that the probability of a chance event is a number between 0 and 1 that expresses the likelihood of the event occurring. Larger numbers indicate greater likelihood. A probability near 0 indicates an unlikely event, a probability around 1/2 indicates an event that is neither unlikely nor likely, and a probability near 1 indicates a likely event.
-
Understand that, just as with simple events, the probability of a compound event is the fraction of outcomes in the sample space for which the compound event occurs.
-
Students develop and employ strategies for understanding and solving problems in ways that leverage the power of technological methods to develop and test solutions.
-
– Asking Questions and Defining Problems
– Developing and Using Models
– Planning and Carrying Out Investigations
– Analyzing and Interpreting Data
– Using Mathematics and Computational Thinking
– Constructing Explanations and Designing Solutions
– Engaging in Argument from Evidence
– Obtaining, Evaluating, and Communicating Information
Vocab
Probability
Game design
Patterns
Randomness
Author
Glowforge
Licensing

Lesson for Download
Lesson Handout
Overview
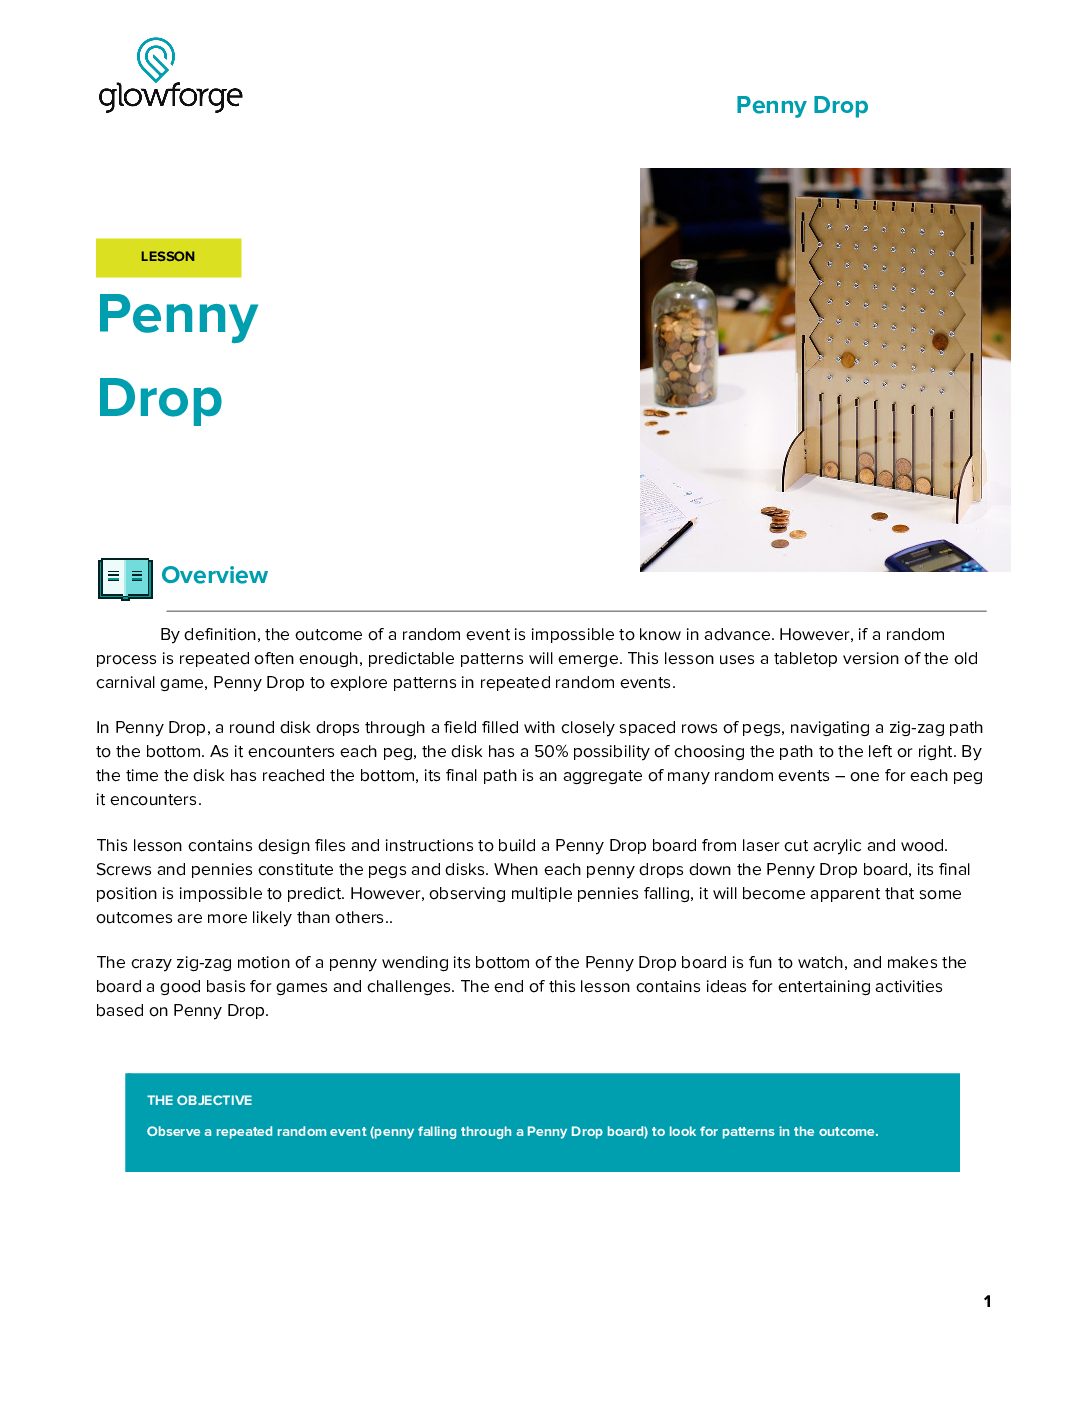
That’s so random. By definition, the outcome of a random event is impossible to know in advance. However, if a random process is repeated often enough, predictable patterns will emerge. In this lesson, students use a tabletop version of the old carnival game, Penny Plinko, to explore patterns in repeated random events. The crazy zig-zag motion of a penny wending its way to the bottom makes Penny Plinko a good way to learn about probability.
Objective
Thematic Questions:
Standards:
ISTE Standards for Students
NGSS Science & Engineering Practices
Supplies
For each Penny Plinko game you will need:
- 1 x Medium Draftboard
- 1 x Clear Acrylic
- 25 Pennies per group
- Materials for customizing finished design (e.g., markers, stickers, pens, or paint)
- Graphing paper
- One of the following selections to use for pegs:
- 107 x (15 mm or 16mm) M3 machine screws and nuts
- 107 x 3mm diameter Nylon Snap Rivets capable of binding a 10mm thick panel
Design Files


Description
Lesson Outline:
Get Ready:
- Read through the activity details to review the steps for completing the activity.
- Sometimes, more complex designs require different materials or multiple sheets of material. They will also show in the Glowforge app in your Dashboard as a few separate prints. For these designs, print them in order and follow any instructions in the design details window.
- Wood Print: PlinkoWoodPieces-2
- Acrylic Print: PlinkoAcrylicPiece-2
- Gather all of the materials needed to print, assemble, and customize the Penny Plinko board.
- Have a printed version of the Penny Plinko board design for individuals or groups to explore prior to assembling and using their own.
Lesson Instructions
Section 1 – Create:
- Plan for printing one Penny Plinko game per group of 3-5 students by gathering all of the materials and reviewing the design in the Glowforge app.
- Print all of the pieces and organize them into sets so that each group has the pieces for a Penny Plinko set.
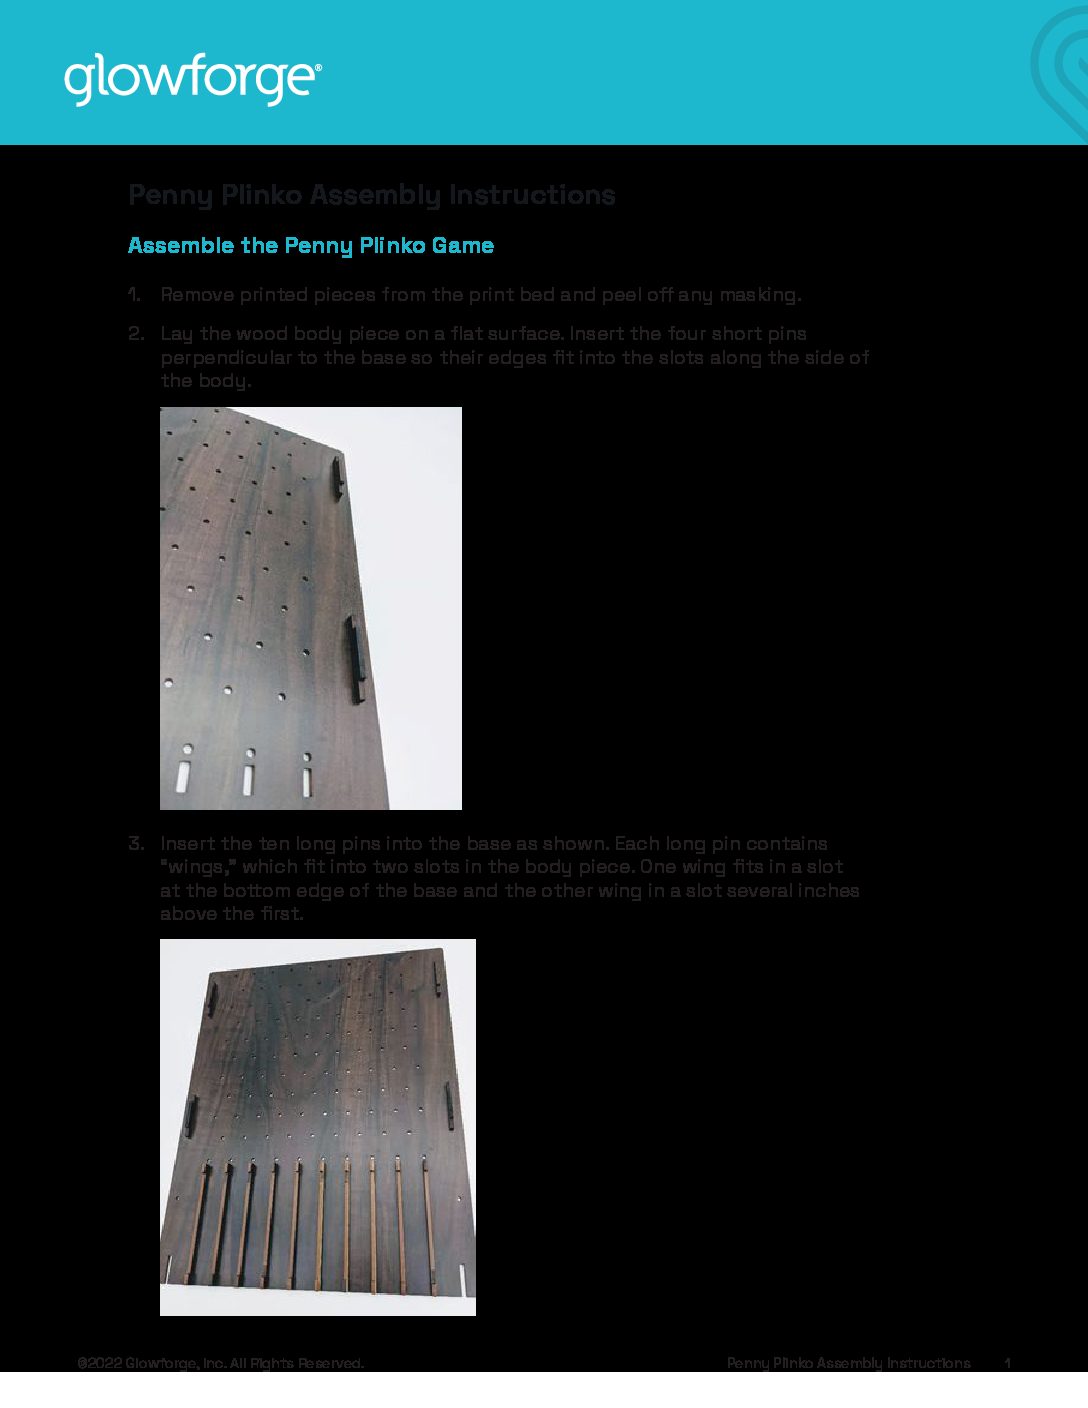
- Have groups assemble the board by following the steps of the Penny Plinko Assembly Instructions.
- Have the groups test their Penny Plinko boards by dropping 5 pennies into the board. As a class, discuss:
- How well do the pieces fit together?
- Did your pennies all make it to the bottom of the board? If not, what might you need to adjust?
- Is there anything that needs to change to make your Penny Plinko board work better?
Section 2 – Use:

- Explain to students that probability is how likely something is to happen. While holding a penny, ask: “If I flip a penny ten times, what is the probability that it will land on heads?” and “What is the probability that it land on tails?” Allow students time to think and then time to discuss as a class.
- Explain that we would expect the coin to land on heads five times and tails five times since there is a 50% chance of either outcome whenever we flip a coin.
- Use ratios to express the probability, or likelihood that an event will happen, of these two outcomes. Because there are two potential outcomes—heads and tails—the ratio would be ½ or 50%. Similarly, if rolling a six-sided die, the ratio for rolling a three would be ⅙ or approximately 17%.
- When calculating probability ratios, the numerator represents the number of desired outcomes and the denominator represents the number of possible outcomes. Again, because a coin has two sides, the numerator is one because both outcomes are equally likely and the denominator is two because there are two options for the outcome.
- To calculate the probability of an outcome with a number of trials other than 100, students can convert the percentage to a decimal and then multiply by the number of trials. For instance, if trying to figure out the expected number of threes if rolling a die 25 times, multiply (.17)x25 to get 4.25. This means that students could expect to roll approximately four threes when rolling 25 times.
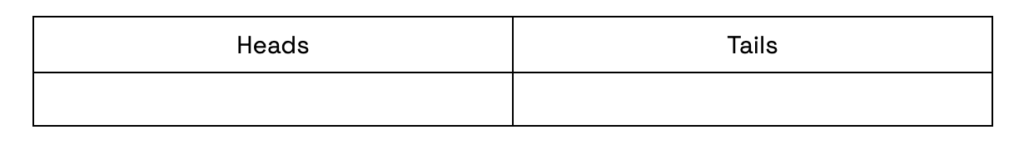
- Have each group make a two-column chart with “Heads” and “Tails” as the headers to help with organizing the data. Groups will collect their data by flipping a coin ten times and marking each flip on the chart based on how the penny lands. Students can keep track of flips by using tick marks or even drawing pennies in each column depending on how the penny lands.
- After the groups have each completed their charts, give them time to analyze their results and discuss how the actual outcomes compare to their predictions. Student interpretations may include:
- I thought that they would be the same, but one had more than the other.
- I wonder why there were more tails than heads.
- Ask: “What would happen if we tried it again but flipped the coin 40 times? 75 times?” Encourage students to use the probability equation from above to calculate the expected values.
- Show The Price Is Right – PLINKO video to the class. At the intervals noted below, stop and ask the questions.
- Pause after the contestant’s first drop and ask: “Where should the contestant drop the second chip in order to win $10,000 more?”
- Pause after the third drop and ask: “The contestant dropped the Plinko piece from the same place as her first drop. Why did the chip land in a different place this time?”
- Point out to students that their Penny Plinko board has 11 slots at the bottom. Ask: “What do you predict would happen if we dropped ten pennies into the board?” and “Do you expect that any slot would have multiple pennies? Why or why not?” Discuss students’ ideas as a class.
- One-at-a-time, drop 10 pennies into the Penny Plinko board at different starting points and demonstrate for the class how the pennies distribute on the board. Ask: “Did the pennies land as you expected?” and “Why do you think that they landed where they did?” Discuss students’ ideas as a class.
- Determine how students will organize and present their results. Some options might be:
- Give each group a piece of graphing paper. Have the groups label columns with 1-11 and explain that they will shade in one box for each penny that lands in the slot.
- Create a Google Slides or PowerPoint template where students can move pictures of pennies on a mock Penny Plinko board.
- Recreate the table from flipping pennies and have students make tallies for each penny.
- To collect their data, give each group 25 pennies. Have the groups slowly place the pennies into the Penny Plinko board. After they drop each penny in the board, encourage students to record their results.
- Have students figure out the probability of pennies landing in each spot. Remind students that they can multiply each result by four to find its percentage out of 100, and that if the pennies are evenly distributed, there would be a 9% [1 out of 11] chance that a penny would land in each slot. Use the questions below for an added challenge in calculating probability.
- What is the probability that a penny lands in an even numbered slot? Is it the same as an odd numbered slot? How might you determine these probabilities?
- Do pennies equally land on the outer slots as they do in the middle slots? What might contribute to this outcome?
Reflection Questions:
Help students consider…
- How did your results compare to your predictions?
- What surprised you the most about the outcome?
- How did your group’s results differ from those of other groups in class?
Pro Tips:
- Have students use stickers or permanent markers to label each slot at the bottom of the Penny Plinko board.
- Place the Penny Plinko boards in small tubs to help contain pennies and for easy storage after doing the activity.
- If using M3 machine screws, be careful not to overtighten the nuts to ensure the pennies are not pinched in between the wood and acrylic layers
Reimagine:
- How can we create math challenges using the random Penny Plinko outcomes? Label each slot in the following order: 1, 2, 3, 4, 5, 6, 5, 4, 3, 2, and 1. Drop four pennies in the Penny Plinko board and find the sum of the results. Consider the bonus challenge of who can get the closest to 20 without going over.
- How might we play fun games using the Penny Plinko boards? Challenge a friend to a game of four in a row. Each player picks either heads or tails. Alternate turns putting pennies into the Penny Plinko board. The first player to get four in the same slot wins.
Meet Glowforge
The magical 3D laser printer that made this lesson possible. Learn more!